How Can We Help?
Gantt Chart
Gantt chart
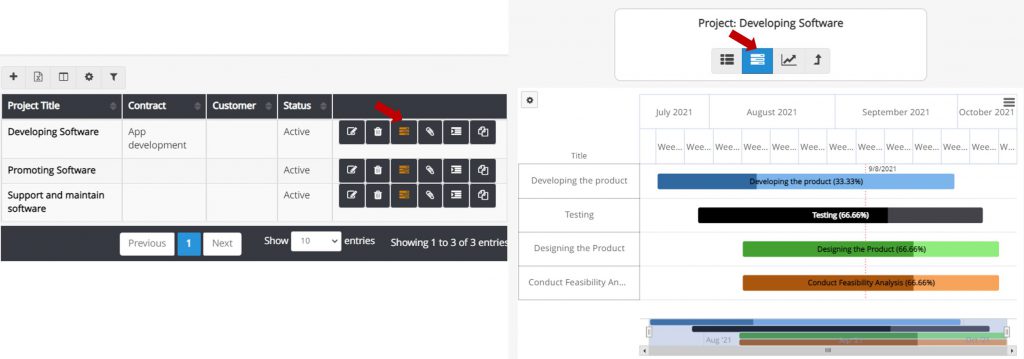
You can access the Gantt chart of a project in 3 ways:
- Taskboard: click on the title of the project located under the task title.
- Projects table 1: There is a Gantt chart icon in front of each row in this table. Click on it to display the Gantt chart.
- Projects table 2: Click on the title of each project to see its tasks table. There is a Gantt icon above this table to display the Gantt chart.

Gantt chart allows you to manage your tasks in the most effective way.
Gantt chart features:
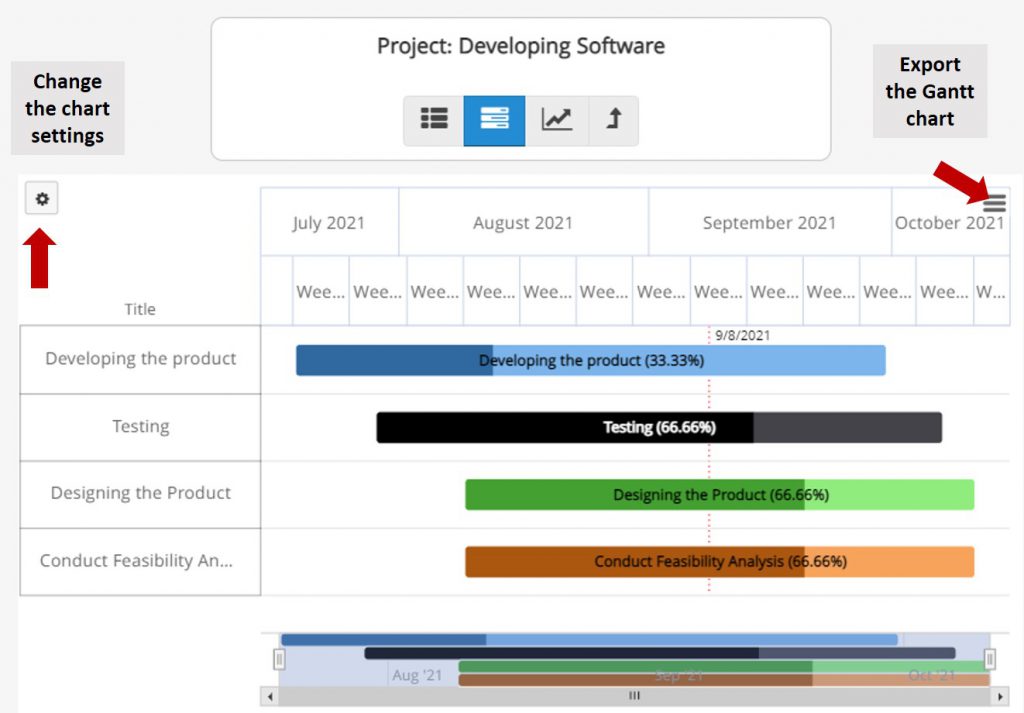
- Using the Gantt chart is simple, and you can easily change it by moving the mouse. e.g., change the start date and due date of the tasks.
- You can export the Gantt chart in the form of an image.
- Click the gear icon to change the chart settings.
Settings:
- Those customers who have many tasks in a project can specify the screen size in the Gantt chart settings section so that the Gantt chart is better displayed for them.
- You can choose not to display completed tasks in Gantt.

Gantt Charts and Task Dependencies
Gantt charts help you identify which tasks need to be completed before others and clearly define the dependencies between tasks.
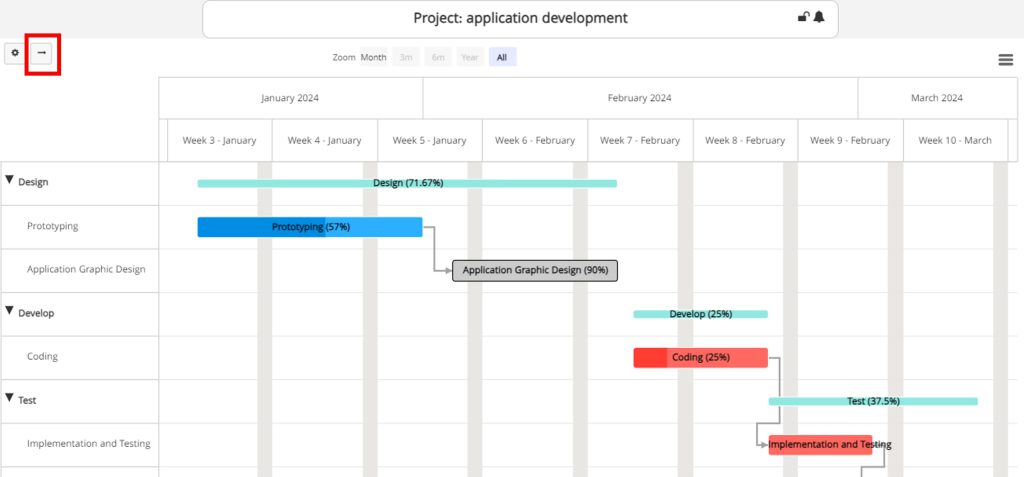
To specify dependencies between tasks, open the Gantt chart after defining the project and its tasks. All project tasks will be shown here. Click on the desired prerequisite task, then click the forward arrow at the top of the Gantt chart (as shown in the image below), and select the related prerequisite task in the final step.
If you click on the line representing the relationship between tasks, you can edit or delete the dependency.
By defining task relationships, the Gantt chart will also display the critical path. Tasks on the critical path are highlighted in red.
