Get a real insight into your organization
TaskBrowse provides a variety of dashboard widgets and reports that enable you to have a deep insight into your company and find out more about the efficiency of your team members and the profitability of your projects. You can drill down the time spent on your projects and task categories or you can have some reports based on your own specified tasks.
If the ready dashboard widgets and reports are not sufficient to fulfill your requirements, you can build your own by the most powerful dashboard or report builder you have ever seen in a project management software.

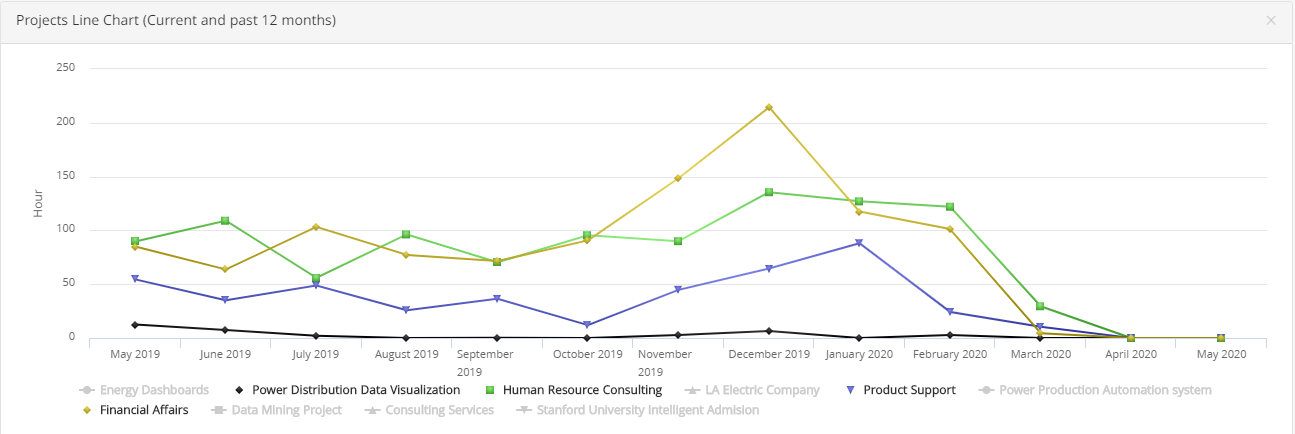
By Project Line chart, you can find out the trend of the time spent on every project in your company.
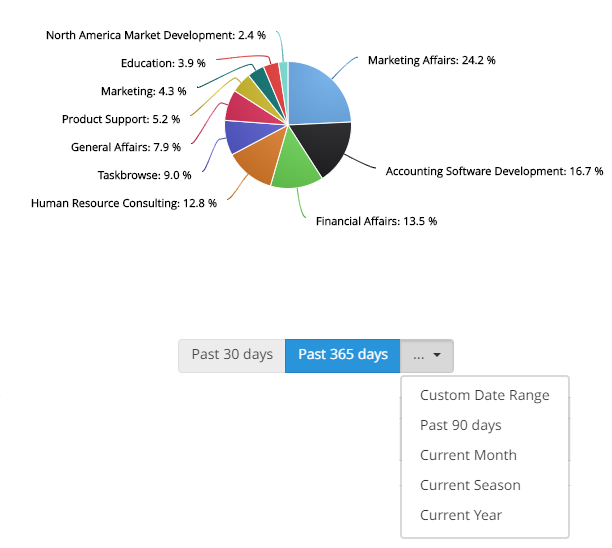
The Pie Chart dashboard widget of “Time on Projects” shows the the share of each project on the time spent in your company.
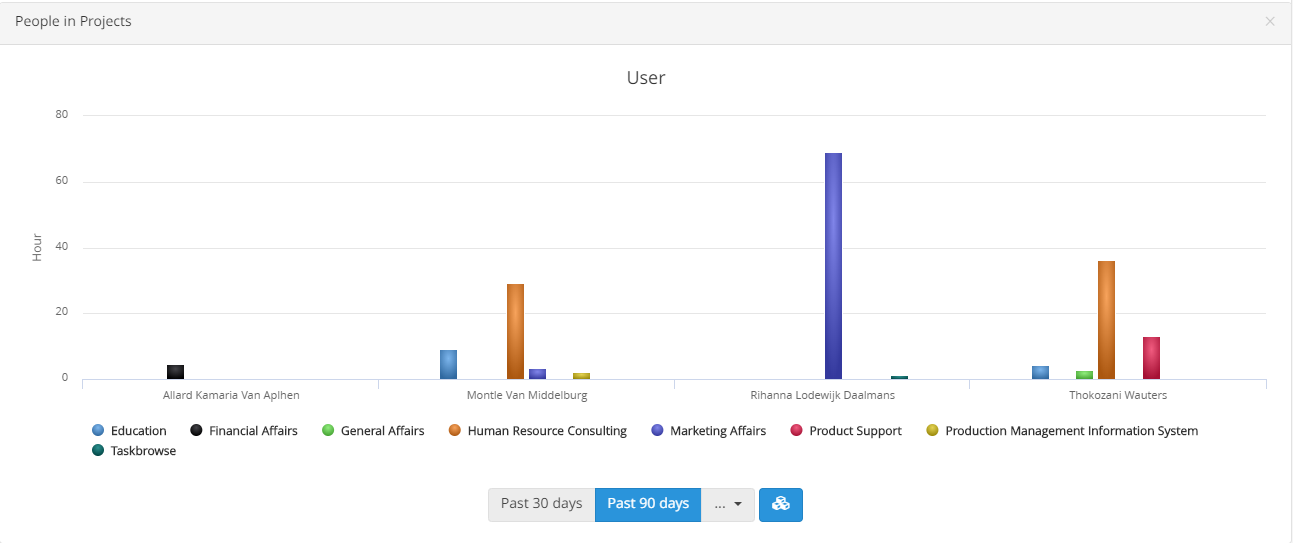
By “People in Projects” bar chart, you can find out the distribution of the time spent by your employees in different projects

Drill Down your reports and mine golden DATA
There are so many built reports in TaskBrowse and you can use them to find out about projects, tasks, and team members. TaskBrowse reports are Drill Down Reports. A report at first glance presents a general image of the organization, team members, or projects. When you feel that you need more data, the flexible structure of the report lets you go down further and find out new pieces of evidence for the current good (or bad) situation you are facing.
https://taskbrowse.com/wp-content/uploads/2020/05/DrillDown-Report.mp4
Do you need your own customized widgets and reports?
Although TaskBrowse ready charts and reports can fulfill daily reporting requirements, you can use our powerful chart and report builder to build your own.